Summary
| Research |
Synthesis |
Design |
Solution |
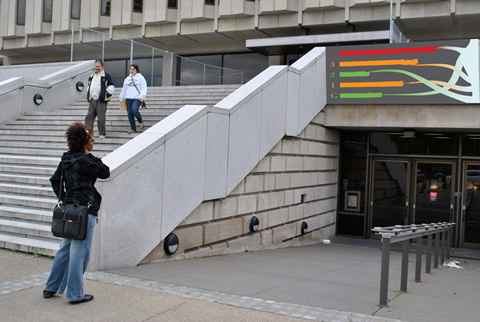
Hillman Library Full-o-Meter
|
Key Features 01
|
|
Sensors 04
|
Design |
01 Key Features |
The final design has the following features:
- At-a-glance visualization of how full a given floor of the library is at any given time.
- The length of the bars indicates the percentage of the total seating space that has been taken up.
- The colors help the users quickly determine how close to full a floor is, with green being mostly empty and red being mostly full.
- The blue section on the right represents the total capacity of the library, and decreases in size as the bars fill up.
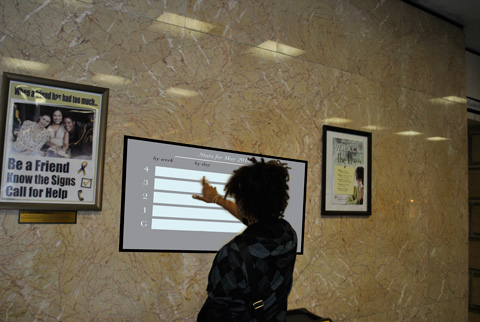
- The interactive display allows users to see the history of the library's population.
- Using the touchscreen, users can select to view the history by year, month, week, day, or hour.
- Using the historical data, the user can predict trends in order to schedule future times to visit or meet at the library.